
Beginning in the 20th century, the options for traveling both near and far drastically increased, moving from literal “horsepower” to motor vehicles and air travel in a single generation. These advancements have democratized travel, making it accessible to a wide range of people, from daily commuters to international globetrotters. But with so many choices available, one question often arises: what is the Safest Way To Travel?
Many people operate under misconceptions when it comes to transportation safety, often guided by perceived risk rather than factual data. While dramatic accidents capture headlines and fuel anxieties, understanding the statistical realities is crucial for making informed decisions about how we travel. Let’s delve into the fatality and injury statistics across various modes of transportation, ranking them from the least safe to the safest way to travel, and reveal some surprising insights.
 The Safest Forms Of Transportation
Key Findings on Transportation Safety
To understand the safest way to travel, it’s essential to look at the data. Here are some key findings based on transportation safety statistics:
- Motorcycles: The Least Safe Mode. Motorcycle travel stands out as the most dangerous, with a fatality rate approximately 24 times higher than that of car accidents per million miles traveled. This stark statistic highlights the vulnerability of motorcycle riders.
- Car Travel: A Significant Risk. While commonplace, car travel is inherently risky due to the sheer volume of vehicles and daily usage. Car accidents contribute significantly to fatalities and injuries, averaging around 102 deaths per day and over five million injuries annually.
- Recreational Boating: Higher Risk than Passenger Boats. Interestingly, private, recreational boating is far more dangerous than passenger boating. Recreational boating accounts for a staggering 90% of boating fatalities, dwarfing the risk associated with passenger boats.
- Rail Crossing Dangers. When it comes to train safety, the primary risk lies at rail crossings. A significant majority of train-related injuries and fatalities occur at these intersections. In 2023, 25% of all train deaths happened at rail crossings, emphasizing the need for caution around train tracks.
- Buses: A Safer Ground Option. Bus transportation, including school buses, charter buses, and city buses, presents a much lower risk compared to other road vehicles. Bus accidents account for less than 10% of annual traffic fatalities in the United States, positioning buses as a relatively safest way to travel on land.
- Airplanes: Statistically the Safest. Despite perceptions of risk associated with flying, airplane travel emerges as the safest way to travel overall. Commercial air travel boasts incredibly low injury and fatality rates per passenger mile compared to all other modes of transportation.
What is The Safest Mode of Transportation Statistically?
It might seem counterintuitive, but when considering the safest way to travel based on statistics, commercial air travel consistently ranks at the top. The idea of soaring through the sky in a metal tube at high altitudes and speeds might trigger anxieties, yet the data reveals a different story. Flying, statistically, is the safest way to travel on Earth.
Airplane Safety: Data-Driven Reassurance
- Astonishingly, the average annual injury rate for air travel is a mere 0.01 injuries per 100 million passenger miles traveled. To put this in perspective, car and truck travel results in 48 injuries for the same distance. This remarkable difference underscores the inherent safety of air travel.
- Furthermore, from 2002 to 2020, commercial air travel achieved an incredible record of zero deaths per 100 million passenger air travel miles each year. This prolonged period of minimal fatalities firmly establishes air travel as exceptionally safe.
- The average annual fatality rate during this period was an extremely low 0.01 deaths per 100 million miles traveled. Airline industry researchers further illustrate this point, calculating that based on 2022 flight fatality data, an individual would have to fly every day for an astounding 25,214 years to statistically experience a fatal accident.
Therefore, while flying might evoke apprehension for some, the reality, backed by extensive data, confirms it as the safest way to travel. The stringent safety protocols, rigorous maintenance schedules, and highly trained professionals in the aviation industry contribute to this exceptional safety record.
Understanding these statistics empowers travelers to make informed decisions, regardless of their destination. While choosing the safest way to travel is important, remember that safety precautions are paramount in any mode of transport. Whether driving, riding, or flying, prioritizing safety measures is crucial for protecting yourself and your loved ones.
What is The Most Dangerous Mode of Transportation?
Conversely, identifying the least safest way to travel is equally important for travelers seeking to minimize risk. Considering vulnerability and exposure to external elements, motorcycles unsurprisingly emerge as the most dangerous mode of transportation, with the highest accident death rate.
Motorcycle Safety: High Risk on the Road
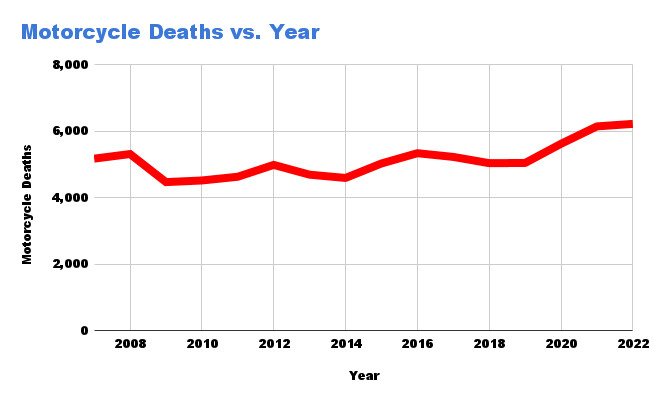
- In 2022, a concerning 6,222 fatal motorcycle crashes occurred, marking the highest number on record and a significant 23% increase since 2019. This upward trend highlights the growing dangers associated with motorcycle riding.
- The fatality rate per mile traveled further emphasizes the risk. For every million miles traveled by motorcycle, there are an alarming 213 deaths, approximately 24 times higher than the car accident fatality rate. This stark contrast underscores the extreme vulnerability of motorcyclists.
- Despite motorcycles constituting only about 3% of all registered vehicles, they account for a disproportionately high 5% of all highway-related fatalities. This statistic further illustrates the elevated risk associated with motorcycle travel.
 Motorycle death chart
The inherent nature of motorcycles, offering minimal protection in accidents, contributes significantly to these elevated risks. Factors like rider skill, road conditions, and visibility play crucial roles in motorcycle safety, but statistically, motorcycles remain the least safest way to travel.
Factors Contributing to Motorcycle Accidents
Several factors contribute to the higher accident rates in motorcycle travel. These include:
- Lack of Protection: Motorcycles offer minimal physical protection to riders in the event of a crash, leaving them vulnerable to severe injuries.
- Visibility Issues: Motorcycles are smaller and less visible than cars, making them harder for other drivers to spot, especially in blind spots or during lane changes.
- Rider Skill and Experience: Motorcycle riding requires a high degree of skill and experience. Inexperienced riders are more prone to accidents, particularly in challenging road conditions.
- Road Hazards: Road hazards like potholes, gravel, and uneven surfaces pose a greater risk to motorcycles than cars due to their two-wheeled nature.
- Driver Negligence: Accidents often occur due to the negligence of car drivers who fail to see or properly judge the speed and distance of motorcycles.
Motorized Transportation Safety: A General Overview
While modern transportation has undeniably revolutionized society, offering unprecedented convenience and speed, it’s important to acknowledge the inherent risks associated with motorized travel. The very factors that make transportation efficient – high speeds and reliance on human operation combined with technology – also contribute to the unfortunate reality of accidents.
Motorized transportation contributes to a significant portion of preventable injury-related deaths, accounting for one in every seven. This statistic underscores the collective risk associated with all forms of motorized travel, from cars and motorcycles to trains and airplanes. While airplanes are statistically the safest way to travel, the overall landscape of motorized transportation necessitates a focus on safety and risk mitigation.
Texas Transportation Safety: State-Specific Insights
Examining transportation safety at a state level can reveal valuable insights. Texas, with its vast size and extensive road network, provides a relevant case study. According to the Texas Department of Transportation, several key trends emerge from their annual motor vehicle crash statistics:
- High Volume of Road Travel: Texas experiences an exceptionally high volume of road travel. In 2023, the annual vehicle miles traveled in Texas reached a staggering 294.785 billion, reflecting the state’s reliance on road transportation.
- Decreasing Fatality Rate: Encouragingly, Texas witnessed a decrease in the motor vehicle traffic fatality rate. The fatality rate on Texas roadways in 2023 was 1.45 deaths per hundred million vehicle miles traveled, a 2.81% decrease from the previous year, indicating improvements in road safety.
- Helmet Use and Motorcycle Safety: Helmet use plays a crucial role in mitigating motorcycle fatalities. In 2023, 599 motorcycle operators and passengers were killed in Texas. Alarmingly, 40% of these fatalities involved motorcyclists who were not wearing helmets at the time of the crash, highlighting the importance of helmet use for motorcycle safety.
- Bus Safety in Texas: Consistent with national trends, buses are a significantly safest way to travel in Texas compared to other vehicles. 2023 Texas crash data reported only 18 fatal injury crashes involving buses, compared to 1,943 fatal passenger vehicle accidents and 610 fatal motorcycle accidents. This data reinforces the relative safety of bus transportation.
Car Safety: Navigating Everyday Risks
 Car accident deaths
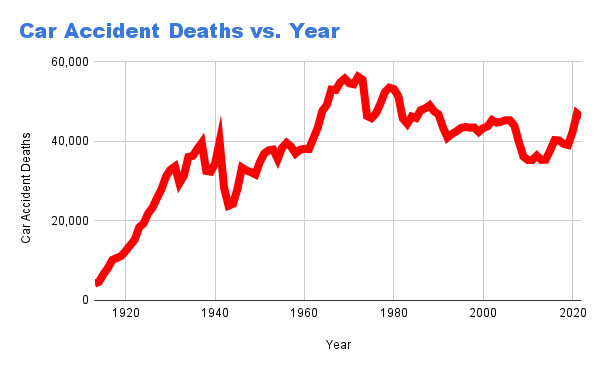
Cars are by far the most ubiquitous mode of transportation globally, with millions relying on them daily. However, this widespread use inevitably translates to substantial accident statistics. While not the least safest way to travel, car travel presents significant risks due to the sheer volume of vehicles on the roads. Some concerning car accident data reveals:
- Six Million Annual Accidents: Approximately six million car accidents occur in the U.S. each year, a staggering figure highlighting the frequency of traffic incidents.
- Daily Fatalities in the Hundreds: Car accidents result in an average of 102 fatalities every day in the United States, underscoring the tragic daily toll of car crashes.
- Fatality Frequency: On average, a driver fatality occurs in every 114 car accidents, and a passenger fatality occurs in every 654 accidents. These ratios, while seemingly low, accumulate to a significant number of deaths annually.
- Millions of Injuries: Over five million car accident injuries occur each year, resulting in significant personal and societal costs.
- High Annual Death Toll: In 2022, motor vehicle crashes claimed 42,514 lives in the United States, a substantial number highlighting the severity of car accident risks.
- Single-Vehicle Crash Prevalence: Over half (53%) of motor vehicle crash deaths in 2022 occurred in single-vehicle crashes, suggesting factors beyond collisions with other vehicles, such as driver error or road conditions, contribute significantly to fatalities.
Despite these alarming statistics, it’s crucial to contextualize the data. While cars are a leading cause of death and injury, the vast majority of car accidents are not fatal. In 2022, with 5,930,496 reported motor vehicle accidents, the 42,514 fatalities mean that less than 1% of total accidents were fatal. This perspective, while not diminishing the risks, provides a more nuanced understanding of car accident statistics.
 accidents vs fatalities
Boat Safety: Recreational vs. Passenger Vessels
Historically, boat travel was fraught with perils, from shipwrecks and piracy to disease and unpredictable weather. Modern boating, thankfully, is considerably safer, especially passenger boat travel. However, significant differences exist in safety levels between passenger and recreational boating. Passenger boats, such as cruise ships and ferries, account for only 10% of boating deaths, while private, recreational boating accidents contribute to the vast majority, 90%.
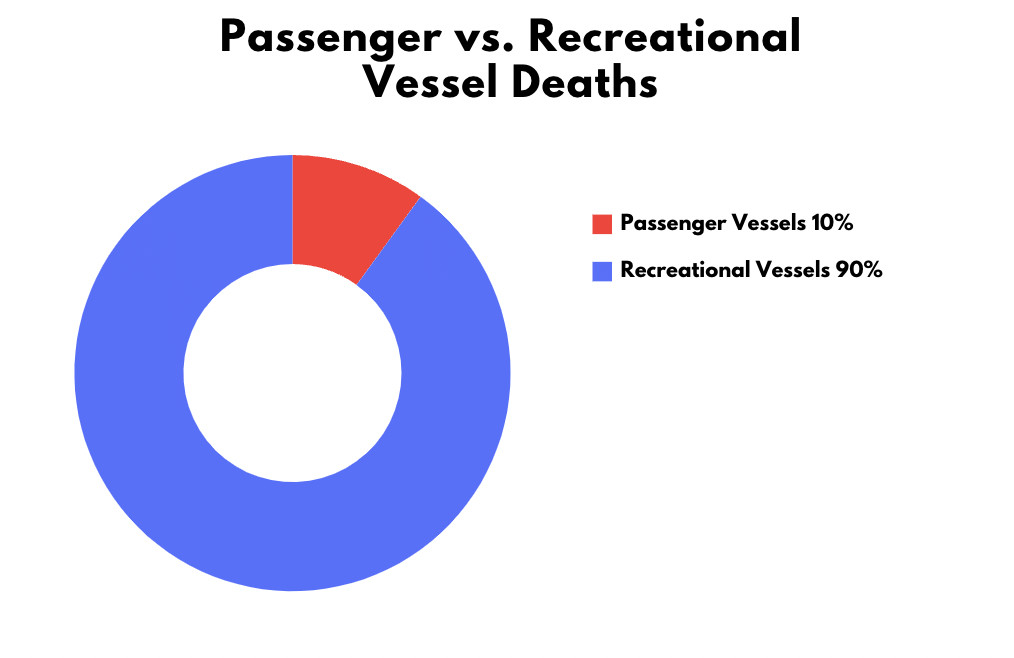 Passenger vs recreational vessel deaths
- Annual Boating Fatalities: Approximately 5,000 boating fatalities occur in the U.S. each year, translating to about 6.5 deaths per 100,000 registered vessels.
- Pandemic Peak in Fatalities: Boating fatalities surged during the COVID-19 pandemic in 2020, experiencing an astonishing 25% increase compared to 2019. This spike may be attributed to increased recreational boating activity during lockdowns.
While passenger boating is relatively safe, recreational boating carries higher risks, often due to factors like alcohol consumption, inexperience, and lack of safety equipment. For those involved in boating accidents, seeking legal counsel from specialized attorneys is crucial to navigate the complexities of maritime law and potential claims.
Train Safety: Rail Travel Realities
Trains have been a reliable and time-tested mode of transportation for centuries. Since the advent of passenger trains in the 19th century, rail travel has evolved significantly. Despite occasional high-profile train accidents that capture public attention, trains are statistically a very safest way to travel, ranking as the third safest mode of transportation overall.
Train Accident Statistics and Safety Facts
- Relatively Low Fatalities: While any train accident is tragic, the overall number of train accident fatalities is relatively low compared to other modes of transport.
- Derailment Frequency: There is an average of 1,689 train derailments per year in the US. However, the vast majority of these derailments do not result in fatalities.
- Derailment Deaths are Rare: Between 1990 and 2022, train derailments caused 132 deaths, averaging about 4 derailment deaths per year. This low figure underscores the safety engineering and operational protocols in place for train travel.
- Crossing Hazards: The most significant risk in train travel lies at rail crossings. A vast majority of train injuries and fatalities occur at these intersections, emphasizing the critical importance of crossing safety and adherence to warning signals.
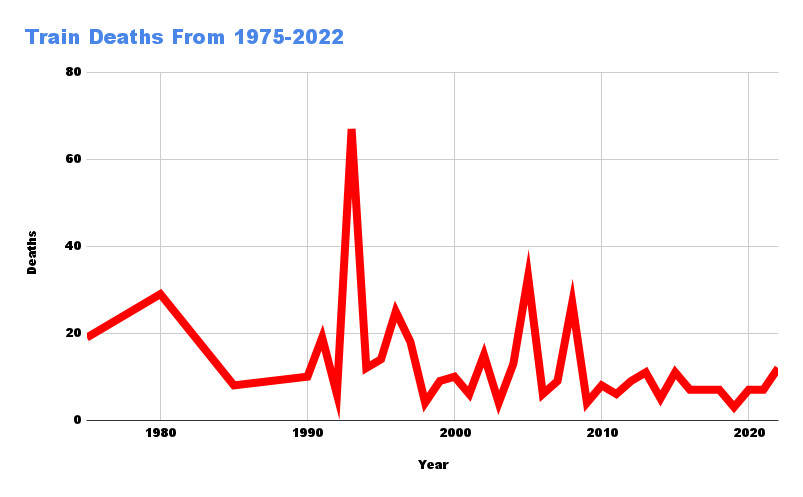 Train deaths
Bus Safety: A Top Tier Ground Transportation Choice
Buses consistently rank as one of the safest ways to travel on land, second only to airplanes in overall transportation safety statistics. This high safety rating is attributed to stringent safety standards, rigorous licensing requirements for commercial bus drivers, and continuous improvements in bus safety features.
- Low Fatality Contribution: All types of bus accidents, including school buses, charter buses, city buses, and airport shuttles, collectively account for less than 10% of annual traffic fatalities in the United States. This small percentage highlights the exceptional safety record of bus transportation.
- Accident and Injury Statistics: In 2022, there were 15,033 bus accidents, of which 219 were fatal and 7,119 resulted in injuries. Importantly, only 1.5% of bus accidents in 2022 were fatal, further emphasizing the relative safety of bus travel.
- State-Specific Accident Data: The top 5 states with the most bus accidents are New York, Florida, Texas, California, and Illinois, reflecting population density and traffic volume in these states.
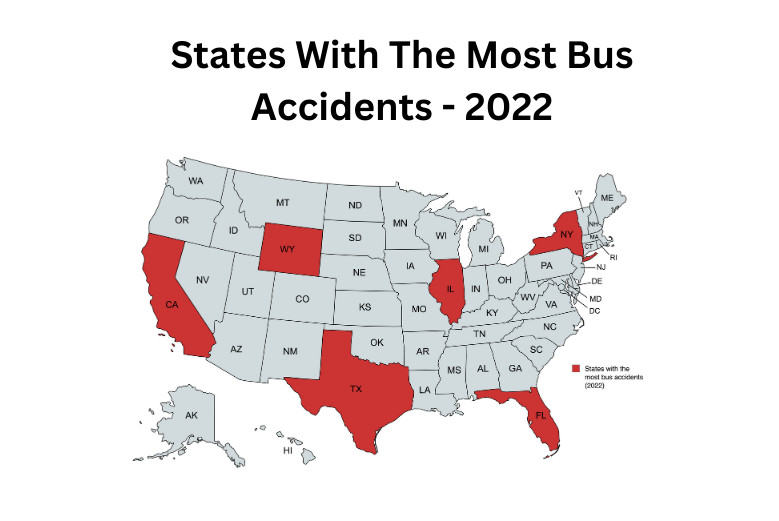 States with the most bus accidents
Conclusion: Prioritizing Safety in Every Journey
Understanding the statistics behind transportation safety empowers us to make informed choices and prioritize safety in our travels. While airplanes statistically represent the safest way to travel overall, and buses offer a very safe ground transportation option, every mode of transport carries some level of risk.
Regardless of whether you are considering the safest way to travel for a long journey or simply commuting locally, being informed about the relative safety of different transportation methods is a crucial step towards responsible travel. Always remember to prioritize safety precautions, adhere to traffic laws, and remain vigilant, no matter which mode of transportation you choose. By combining informed decision-making with consistent safety practices, we can all contribute to safer journeys for ourselves and others.