
The 20th century marked a turning point in travel history, witnessing an unprecedented expansion in transportation options. From horse-drawn carriages to automobiles and airplanes within a single generation, accessibility to travel transformed dramatically. This progress has democratized travel, enabling everyone from daily commuters to international travelers to navigate vast distances with ease.
However, perceptions of travel safety often diverge from reality. In the aftermath of travel-related accidents, legal professionals, such as Austin personal injury lawyers, are crucial in assisting victims in Texas to pursue justice and compensation. Therefore, it’s essential to examine the factual safety data associated with different modes of transportation. This article delves into fatality and injury statistics to rank transportation methods from least to most safe, revealing surprising insights about what truly constitutes the Safest Form Of Travel.
 The Safest Forms Of Transportation
Key Findings
- Motorcycles are statistically the least safe form of travel. Their fatality rate is approximately 24 times higher than that of passenger cars per mile traveled.
- Car travel, while common, carries significant risks. Car accidents in the U.S. result in an average of 102 deaths daily and over five million injuries annually.
- Recreational boating poses a greater risk than passenger boating. Private recreational boats account for 90% of boating fatalities, highlighting the increased danger compared to passenger vessels.
- Railroad crossing accidents are the primary train safety concern. The majority of train-related injuries and deaths occur at these crossings. In 2023, 25% of all train fatalities happened at rail crossings.
- Bus transportation is a relatively safe option. Bus accidents, including school, charter, city, and airport buses, represent less than 10% of yearly traffic fatalities in the U.S.
- Air travel is identified as the safest form of transportation. Commercial airplanes have an exceptionally low injury rate, averaging just 0.01 injuries per 100 million passenger miles.
What is The Safest Mode of Transportation?
It might seem counterintuitive, but flying, despite involving hurtling through the sky in a metal tube at high altitudes and speeds, is statistically the safest form of travel available. Commercial air travel consistently demonstrates remarkably low accident and fatality rates, making it the safest mode of transportation when analyzed by data.
Airplane Safety
- Astonishingly, the average annual injury rate for air travel is a mere 0.01 injuries per 100 million passenger miles traveled. This contrasts sharply with car and truck travel, which records 48 injuries for the same distance.
- Notably, zero fatalities per 100 million passenger air travel miles were recorded annually between 2002 and 2020, underscoring the exceptional safety record of air travel during this period.
- The average annual fatality rate during those years was an incredibly low 0.01 deaths per 100 million miles traveled. Airline industry researchers emphasize this point, stating that based on 2022 data, an individual would need to fly every single day for 25,214 years to statistically be involved in a fatal airplane accident.
Therefore, while the perception of air travel might be associated with risk due to high-profile incidents, statistics clearly indicate that the probability of serious injury or death is significantly lower compared to other common modes of transportation. Understanding these statistics empowers travelers to make informed decisions regarding their transportation choices, prioritizing safety regardless of their destination. Regardless of whether choosing to drive, ride, or fly, adhering to all safety guidelines remains paramount for personal protection and the well-being of loved ones.
What is The Most Dangerous Mode of Transportation?
Motorcycles, offering minimal physical protection to riders, understandably have the unfortunate distinction of being the most dangerous mode of transportation, reflected in their alarmingly high accident and fatality rates. This makes motorcycle travel the antithesis of the safest form of travel.
Motorcycle Safety
In 2022, there were 6,222 fatal motorcycle crashes, marking a record high and a 23% increase since 2019, demonstrating a worrying trend in motorcycle accident fatalities.
Moreover, for every million miles traveled by motorcycle, there are a staggering 213 deaths. This is approximately 24 times higher than the car accident fatality rate, highlighting the extreme risk disparity between these two modes of transport. Despite motorcycles constituting only 3% of registered vehicles, they account for a disproportionate 5% of all highway-related fatalities, underscoring their over-representation in fatal accidents.
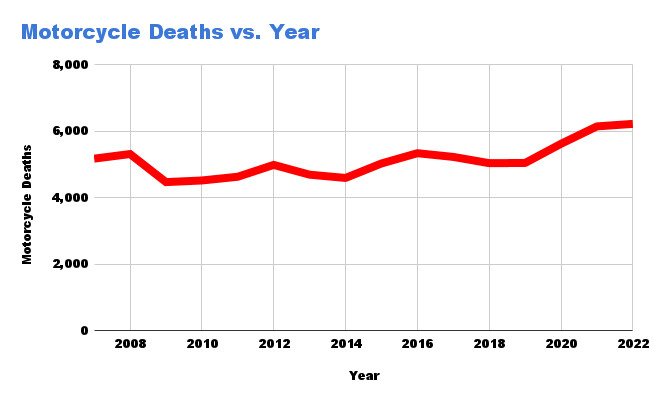 Motorycle death chart
Leading Causes Of Motorcycle Accidents
[Content about leading causes of motorcycle accidents would be placed here in a longer article, but is omitted based on the length constraints and focus on comparative safety.]
Motorized Transportation Safety Overview
Modern motorized transportation has undeniably revolutionized society, bringing unprecedented convenience and comfort. However, this progress comes with inherent risks. The reliance on high speeds and human operation, even with technological aids, means accidents are unfortunately a persistent reality across all motorized transport modes.
Motorized transportation contributes to one in seven preventable injury-related deaths, emphasizing the significant public health impact of transportation-related accidents.
Texas Transportation Safety Overview
According to the annual Texas motor vehicle crash statistics compiled by the Texas Department of Transportation:
- Texas experiences exceptionally high road travel volume. In 2023, vehicle miles traveled in Texas reached an astounding 294.785 billion miles.
- Texas has seen a decrease in motor vehicle traffic fatalities. The fatality rate on Texas roads in 2023 was 1.45 deaths per hundred million vehicle miles traveled, a 2.81% decrease from the previous year, indicating some improvement in road safety.
- Helmet use is crucial for motorcycle safety in Texas. In 2023, 599 motorcycle operators and passengers died in crashes, and a concerning 40% of those killed were not wearing helmets, highlighting the life-saving potential of helmet use.
- Buses are a significantly safer mode of transport in Texas. Texas crash data for 2023 reported only 18 fatal injury crashes involving buses, compared to 1,943 fatal passenger vehicle accidents and 610 fatal motorcycle accidents, reaffirming buses as a safer alternative.
Car Safety
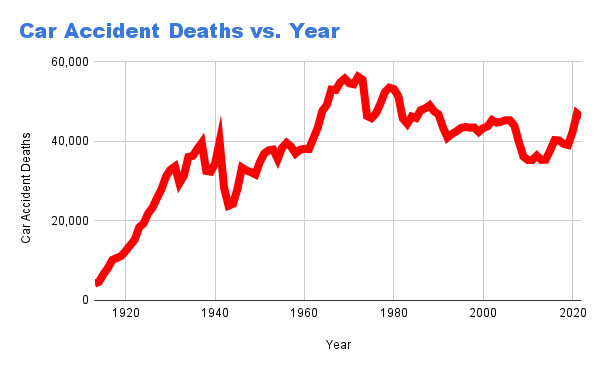 Car accident deaths
Cars are the most ubiquitous mode of transportation, with daily car journeys being a routine for most Americans. However, the sheer volume of cars and drivers on roads results in substantial accident, injury, and fatality statistics. Shocking car accident data reveals:
- Six million car accidents occur in the U.S. annually, a staggering figure highlighting the frequency of car accidents.
- An average of 102 fatalities occur each day due to car accidents in the U.S.
- A driver fatality occurs in approximately every 114 car accidents.
- A passenger fatality occurs in every 654 car accidents.
- Over five million car accident injuries happen annually in the United States.
- In 2022, there were 42,514 deaths from motor vehicle crashes in the U.S.
- 53% of motor vehicle crash deaths in 2022 involved single-vehicle crashes, suggesting factors beyond just collisions with other vehicles contribute significantly to fatalities.
Despite these alarming figures, it’s important to contextualize them. While cars are involved in a high number of accidents and are a leading cause of death and injury, the proportion of fatal accidents compared to the total number of accidents is relatively low.
In 2022, of the 5,930,496 motor vehicle accidents reported to police, 42,514 were fatal. This means less than 1% of all car accidents resulted in a fatality, indicating that while accidents are common, fatal outcomes are statistically less frequent.
 accidents vs fatalities
Boat Safety
Historically, boat travel was perilous, fraught with dangers ranging from shipwrecks and piracy to disease. Modern boat travel, particularly passenger boating, is significantly safer. Passenger vessels like cruise ships and ferries account for only 10% of boating fatalities, while private recreational boating accidents constitute the remaining 90%, indicating a higher risk associated with recreational boating activities.
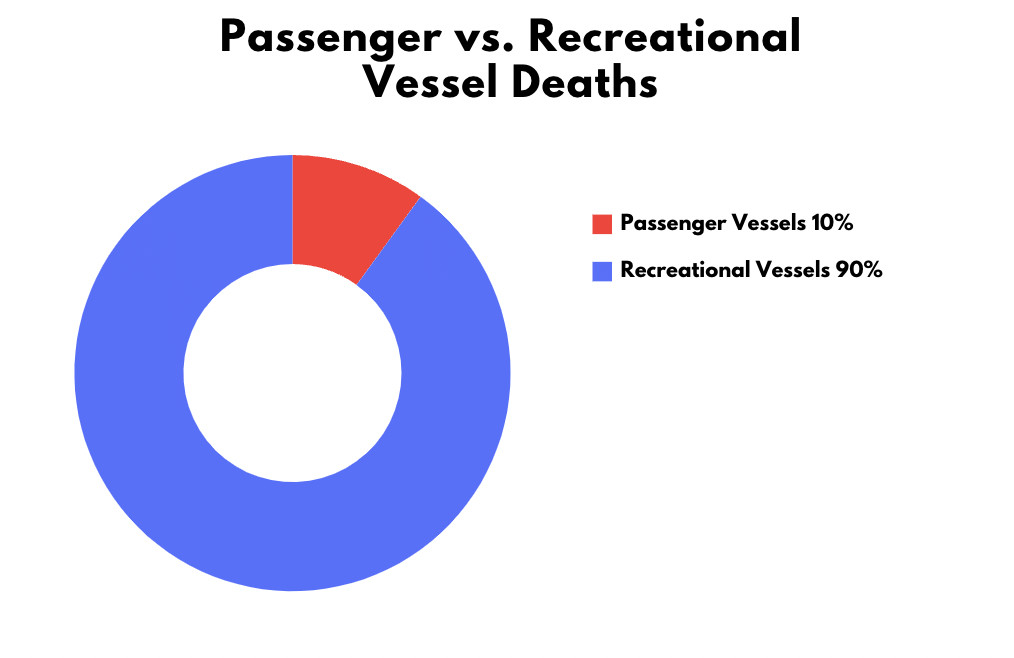 Passenger vs recreational vessel deaths
Approximately 5,000 boating fatalities occur annually in the U.S., equating to about 6.5 deaths per 100,000 registered vessels. Boating fatalities saw a peak during the COVID-19 pandemic in 2020, with a significant 25% increase over 2019, possibly due to increased recreational boating activity.
Train Safety
Trains have provided a reliable mode of transport since the first passenger train journeyed in England in 1825. Technological advancements have made train accidents relatively uncommon. While train accidents often gain significant media attention, potentially skewing public perception, trains are statistically the third safest form of transportation, with comparatively low injury and fatality numbers.
467 people have died from train accidents in the US since 1975
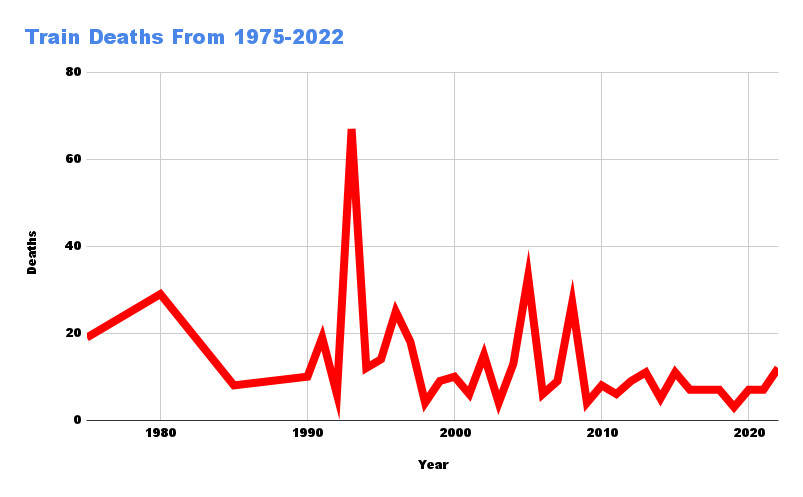 Train deaths
Additional train accident safety facts include:
- There is an average of 1,689 train derailments annually, though most do not result in fatalities.
- Between 1990 and 2022, 132 people died in train derailments, averaging about 4 derailment deaths per year, highlighting that derailments, while frequent, are rarely fatal for passengers.
- The majority of train injuries and fatalities occur at railroad crossings, emphasizing the danger at these specific points rather than on trains themselves.
Bus Safety
The U.S. Department of Transportation (DOT) safety regulations, stringent commercial bus driver licensing, and advancements in bus safety technologies collectively make bus travel the second safest form of travel.
All types of bus accidents, including school buses, charter buses, city buses, and airport shuttles, account for less than 10% of the total annual traffic fatalities in the United States. This clearly positions buses as significantly safer than many other forms of road transportation.
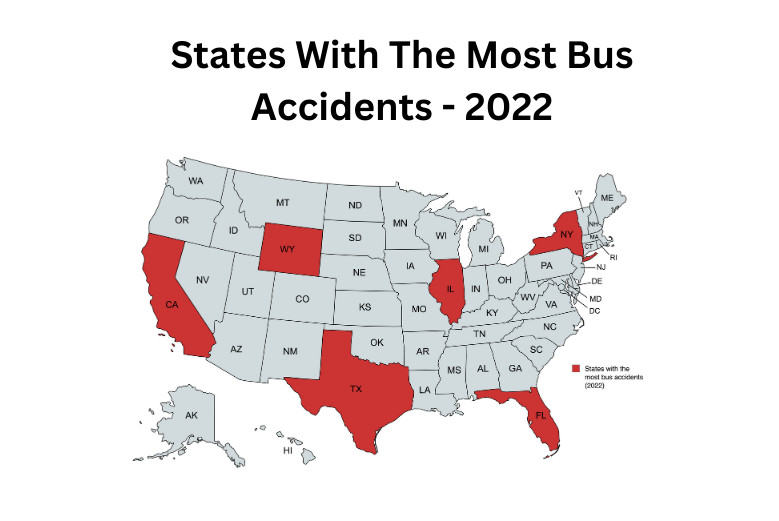 States with the most bus accidents
Bus Accident Safety Facts:
- In 2022, there were 15,033 bus accidents, of which 219 were fatal.
- Out of the 15,033 accidents, 7,119 resulted in injuries.
- 1.5% of bus accidents in 2022 were fatal, indicating a low fatality rate relative to the total number of accidents.
- The top 5 states with the most bus accidents are:
- New York
- Florida
- Texas
- California
- Illinois
For anyone involved in a transportation accident, seeking legal advice is crucial. The Austin accident attorneys at Shaw Cowart offer expert consultation to review individual cases and provide guidance.